The introduction of microtransit mobility, on-demand technology enabled public transportation service
that uses smaller vehicles like vans or mini shuttles, in replacement of public fixed route bus routes has become a huge issue across the nation. Transit agencies are looking to microtransit as a solution however bringing these services in house and cutting regular bus service poses a multitude of threats to quality of service itself, unionized jobs, environmental impact, and reinforcing inequities.
Below a map of Microtransit across the US, peer reviewed by TRUST members.
View full screen map
Download Microtransit Data 1 Pager Here
(1-Pager Accessible Text Below)
Link to Peer Reviewed Spreadsheet
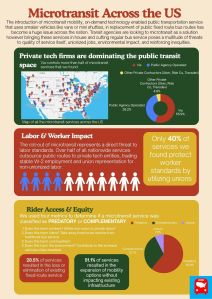
The introduction of microtransit mobility—an on-demand, technology-enabled public transportation service using smaller vehicles like vans or mini-shuttles—in replacement of public fixed-route bus routes has become a significant issue across the nation. Transit agencies are looking to microtransit as a solution; however, replacing regular bus services poses multiple threats to service quality, unionized jobs, environmental impact, and equity.
Private tech firms are dominating the public transit space. The breakdown of operators for microtransit services across the United States is as follows:
- Via: 55.9% (controls more than half of all identified services)
- Public Agency Operated: 39.2%
- Other Private Contractors (Uber, RideCo, Transdev): 4.8%
Labor & Worker Impact
- The roll-out of microtransit represents a direct threat to labor standards
- Over half of all nationwide services outsource public routes to private tech entities, trading stable W-2 employment and union representation for non-unionized labor.
- Only 40% of identified services protect worker standards by utilizing unions.
Rider Access & Equity: Four core metrics were used to determine whether a microtransit service is classified as Predatory or Complementary:
- Harm to Workers: Does it utilize non-union or private labor?
- Harm to Riders: Does it take away fixed-route service from traditional bus operations?
- Harm to Communities: Does it negatively affect broader community access?
- Harm to the Environment: Does it contribute to an increase in vehicle miles traveled?
28.5% of services resulted in the loss or elimination of existing fixed-route service
51.1% of services resulted in the expansion of mobility options without impacting existing infrastructure

